Can there be more than one optimal point on a budget constraint graph?

In the microeconomic theory of Consumer Behavior, the standard case is that the optimal consumption bundle is given by the point of tangency between the (generally assumed to be convex) Indifference Curves and the Budget Line.
^ This tangency condition is often succinctly summarized as MRS = price ratio
where
i) MRS is slope of the ICs,
ii) price ratio is the slope of the budget line, and
iii) condition for a straight line to be tangent to a curve at point X generally goes like : slope of the straight line = slope of the curve at point X
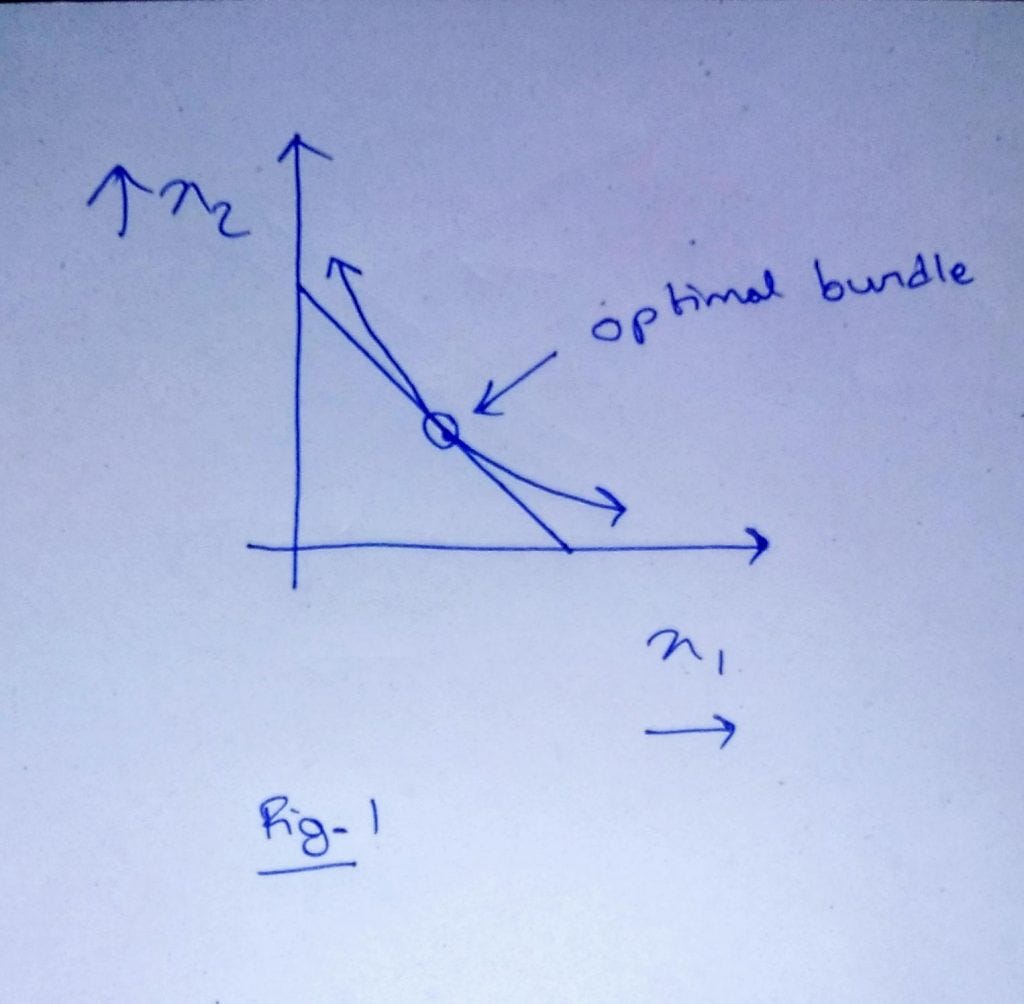
As you can see from Fig1, if you only allow
i) the IC's to be strictly convex i.e. bending away from the origin; and
ii) budget constraint graph to be a straight line
then there can be only one point of tangency.
IF . . . however any one of those restrictions are suspended,
then your microeconomic tool-set
(analysis using budget / cost lines & iso- utility / quantity curves)
greatly expands in analytical and expressive capacity in that you can capture and analyze many additional situations of economic incentive and behavior.
In particular, there are two situations that come to mind where the the budget line wont be a straight line but rather broken into segments.
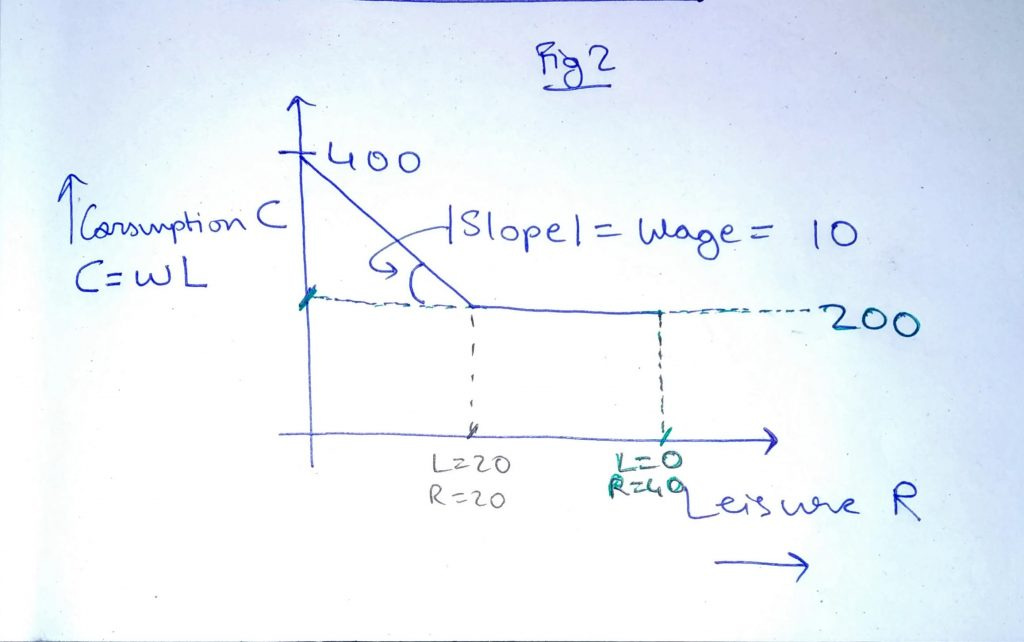
1) (Labor-Leisure aka Consumption-Leisure tradeoff)
Consider the example of an imagined individual deciding how to allocate time between Leisure and Working.
After 8 hours of sleep they have 40 hours available for either Work (L) or Leisure (R) so that L + R = 40
If they don't work at all i.e. L = 0, R = 40,
they get unemployment benefit of $200 a week.
If they work, they receive wage $10 an hour so thatConsumption C = wage * hours worked = 10L
which they can spend on consumption
. . . BUT there's a catch: for every dollar they earn there is a 1:1 reduction in the amount of their welfare payment
^ if you think about it, this means two things:
i) by the time they've worked worked 20 hours, the contribution of the welfare payment to their consumption has dropped to zero.
ii) up till the point L = 20 consumption is actually constant at $200 (see Figure 2)
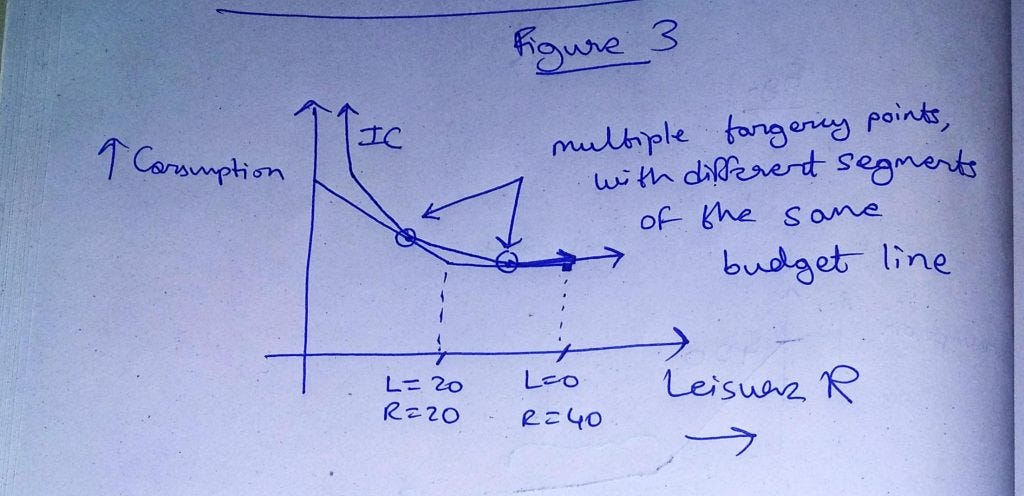
In this situation we can easily imagine multiple points of tangency with the same IC (see Figure 3)
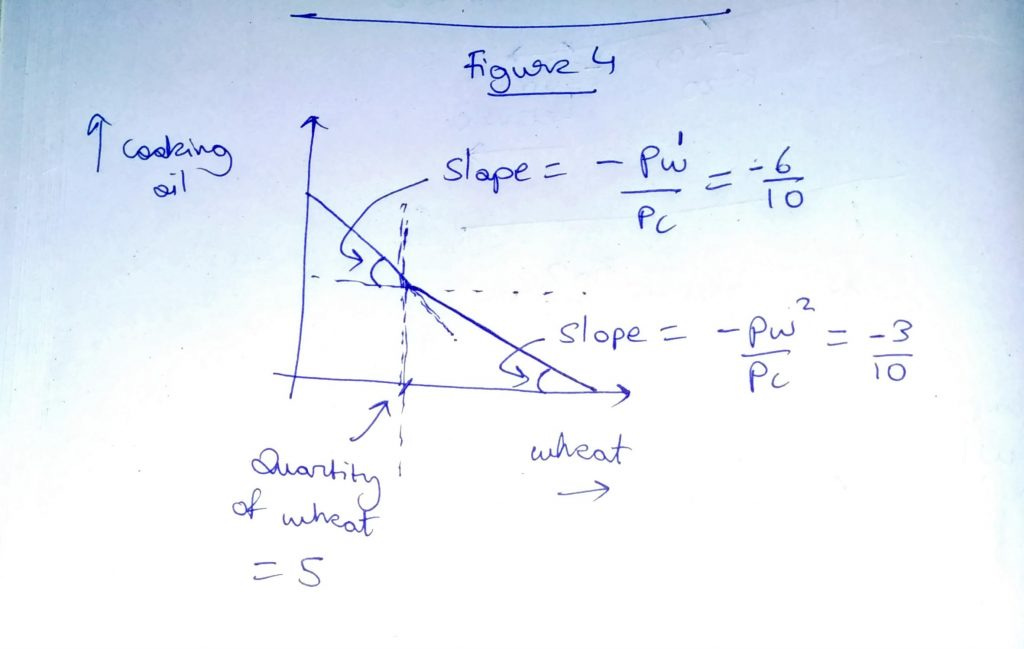
2) (Bundle Discount)
This is the case when you're charged a lower amount for one good after a certain quantity, so price ratio changes after that point; implying that budget line "breaks" into a second segment at that point.
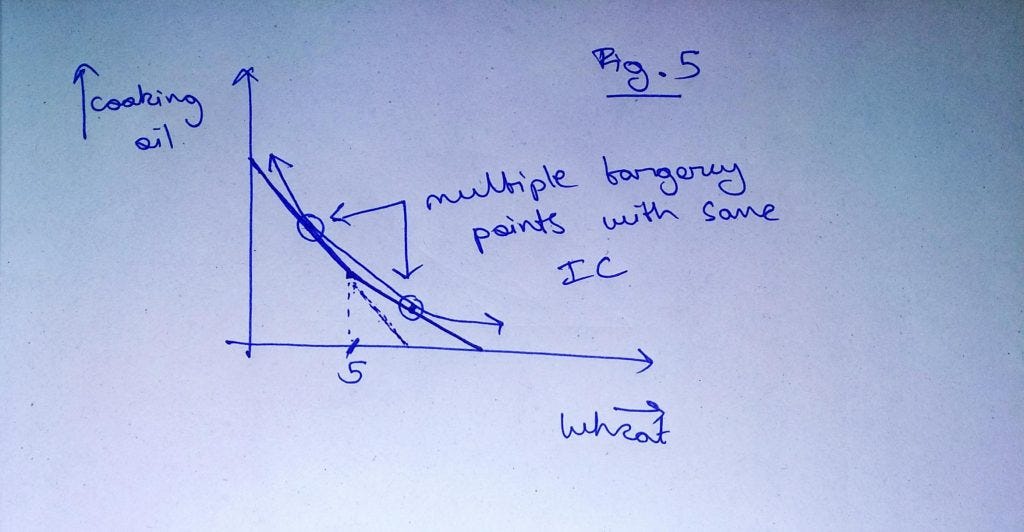
Example: Consider a supermarket which stocks two items, wheat and cooking oil. Price of wheat is $6 per unit (e.g. per kilo) initially, whereas price of cooking oil is $10 per unit (e.g. per liter).
Now suppose the supermarket puts up a discount offer:
all wheat units after the 5th unit available at $3 (instead of $6);
then the budget line would break into a new segment at the point
Q(wheat) = 5
{see Figure 4}
Here also - because there are multiple segments of the budget line with different slopes - we can imagine multiple tangency points {see Figure 5}
As we grapple with our subject of choice to gain deeper understanding, we pick up interesting examples, exceptions and interpretations along the way.
These two popped to my mind almost as soon as I'd done reading the question sentence.
I'm sure there are others, I'll update the list as a go along.
In the meanwhile is there something maybe you'd like to contribute? Share with us in the comment section below-